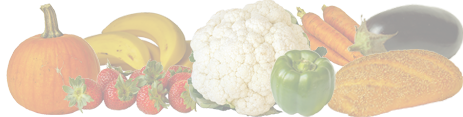
Fruits
ac..av, ba..bo, br..ch, cl..da, da..gr, gr..ki, ku..lo, ma..ol, or..pe, pe..pl, po..ro, sa..wa
| mamey sapote | mammy-apple | mango | melon (cantaloupe) |
melon (casaba) |
melon (honeydew) |
mulberries | nance (frozen) |
nectarine | olives, ripe (canned) |
|
| Serving Size | 1/2 cup (87.5 g) | 1/4 fruit (211.5 g) | 1/2 cup (82.5 g) | 1/2 cup (80 g) | 1/2 cup (85 g) | 1/2 cup (85 g) | 20 fruit (30 g) | 15 fruit (49 g) | 1 fruit (142 g) | 8 large (35.2 g) |
| Macronutrients | ||||||||||
| Calories (kcal) | 108 | 108 | 50 | 27 | 24 | 31 | 13 | 36 | 62 | 40 |
| Protein (g) | 1.27 (3%) | 1.06 (2%) | 0.68 (1%) | 0.67 (1%) | 0.94 (2%) | 0.46 (1%) | 0.43 (1%) | 0.32 (1%) | 1.51 (3%) | 0.30 (1%) |
| Total Fat (g) | 0.40 (1%) | 1.06 (1%) | 0.31 | 0.15 | 0.09 | 0.12 | 0.12 | 0.57 (1%) | 0.45 (1%) | 3.76 (5%) |
| Total Carbohydrates (g) | 28.09 | 26.44 | 12.36 | 6.53 | 5.59 | 7.73 | 2.94 | 8.32 | 14.98 | 2.20 |
| Dietary Fiber (g) | 4.7 (17%) | 6.3 (23%) | 1.3 (5%) | 0.7 (3%) | 0.8 (3%) | 0.7 (3%) | 0.5 (2%) | 3.7 (13%) | 2.4 (9%) | 1.1 (4%) |
| Sugar (g) | 17.62 | - | 11.27 | 6.29 | 4.84 | 6.90 | 2.43 | 4.07 | 11.20 | 0 |
| Vitamins | ||||||||||
| Vitamin C (mg) | 20.1 (22%) | 29.6 (33%) | 30.0 (33%) | 29.4 (33%) | 18.5 (21%) | 15.3 (17%) | 10.9 (12%) | 45.3 (50%) | 7.7 (9%) | 0.3 |
| Thiamin (mg) | 0.011 (1%) | 0.042 (4%) | 0.023 (2%) | 0.033 (3%) | 0.013 (1%) | 0.032 (3%) | 0.009 (1%) | 0.007 (1%) | 0.048 (4%) | 0.001 |
| Riboflavin (mg) | 0.102 (8%) | 0.085 (7%) | 0.031 (2%) | 0.015 (1%) | 0.026 (2%) | 0.010 (1%) | 0.030 (2%) | 0.009 (1%) | 0.038 (3%) | 0 |
| Niacin (mg) | 1.253 (6%) | 0.846 (4%) | 0.552 (3%) | 0.587 (3%) | 0.197 (1%) | 0.355 (2%) | 0.186 (1%) | 0.142 (1%) | 1.597 (8%) | 0.013 |
| Pantothenic Acid (mg) | 0.347 (7%) | 0.218 (4%) | 0.163 (3%) | 0.084 (2%) | 0.071 (1%) | 0.132 (3%) | - | 0.088 (2%) | 0.263 (5%) | 0.005 |
| Vitamin B6 (mg) | 0.630 (37%) | 0.212 (12%) | 0.098 (6%) | 0.058 (3%) | 0.139 (8%) | 0.075 (4%) | 0.015 (1%) | 0.010 (1%) | 0.036 (2%) | 0.003 |
| Folate (mcg) | 6 (2%) | 30 (8%) | 35 (9%) | 17 (4%) | 7 (2%) | 16 (4%) | 2 (1%) | 4 (1%) | 7 (2%) | 0 |
| Vitamin B12 (mcg) | 0 | 0 | 0 | 0 | 0 | 0 | 0 | 0 | 0 | 0 |
| Vitamin A (IU) | 125 (3%) | 486 (10%) | 893 (18%) | 2706 (54%) | 0 | 42 (1%) | 8 | 36 (1%) | 471 (9%) | 142 (3%) |
| Vitamin E (mg) | 1.85 (6%) | - | 0.74 (2%) | 0.04 | 0.04 | 0.02 | 0.26 (1%) | 0.61 (2%) | 1.09 (4%) | 0.58 (2%) |
| Vitamin K (mcg) | - | - | 3.5 (3%) | 2.0 (2%) | 2.1 (2%) | 2.5 (2%) | 2.3 (2%) | 5.8 (5%) | 3.1 (3%) | 0.5 |
| Minerals | ||||||||||
| Calcium (mg) | 16 (1%) | 23 (2%) | 9 (1%) | 7 (1%) | 9 (1%) | 5 | 12 (1%) | 23 (2%) | 9 (1%) | 31 (2%) |
| Iron (mg) | 0.68 (4%) | 1.48 (8%) | 0.13 (1%) | 0.17 (1%) | 0.29 (2%) | 0.14 (1%) | 0.56 (3%) | 0.19 (1%) | 0.40 (2%) | 1.16 (6%) |
| Magnesium (mg) | 10 (3%) | 34 (9%) | 8 (2%) | 10 (3%) | 9 (2%) | 8 (2%) | 5 (1%) | 10 (3%) | 13 (3%) | 1 |
| Phosphorus (mg) | 23 (2%) | 23 (2%) | 12 (1%) | 12 (1%) | 4 | 9 (1%) | 11 (1%) | 5 | 37 (3%) | 1 |
| Potassium (mg) | 397 (8%) | 99 (2%) | 139 (3%) | 214 (5%) | 155 (3%) | 194 (4%) | 58 (1%) | 120 (3%) | 285 (6%) | 3 |
| Sodium (mg) | 6 | 32 (1%) | 1 | 13 (1%) | 8 | 15 (1%) | 3 | 1 | 0 | 259 (11%) |
| Zinc (mg) | 0.17 (2%) | 0.21 (2%) | 0.07 (1%) | 0.14 (1%) | 0.06 (1%) | 0.08 (1%) | 0.04 | 0.04 | 0.24 (2%) | 0.08 (1%) |
| Copper (mg) | 0.186 (21%) | 0.182 (20%) | 0.092 (10%) | 0.033 (4%) | 0.051 (6%) | 0.020 (2%) | 0.018 (2%) | 0.020 (2%) | 0.122 (14%) | 0.088 (10%) |
| Manganese (mg) | 0.178 (8%) | - | 0.052 (2%) | 0.033 (1%) | 0.030 (1%) | 0.023 (1%) | - | 0.122 (5%) | 0.077 (3%) | 0.007 |
| Selenium (mcg) | - | 1.3 (2%) | 0.5 (1%) | 0.3 (1%) | 0.3 (1%) | 0.6 (1%) | 0.2 | 0.2 | 0 | 0.3 (1%) |
| Fatty Acids | ||||||||||
| Saturated Fat (g) | 0.148 (1%) | 0.288 (1%) | 0.076 | 0.041 | 0.021 | 0.032 | 0.008 | - | 0.036 | 0.498 (2%) |
| Monounsaturated Fat (g) | 0.089 | 0.434 | 0.116 | 0.002 | 0.002 | 0.003 | 0.012 | - | 0.125 | 2.777 |
| Polyunsaturated Fat (g) | 0.085 | 0.167 | 0.059 | 0.065 | 0.033 | 0.050 | 0.062 | - | 0.160 | 0.321 |
Unless specified, all fruits in this table are raw.
Unless specified, all canned fruits in this table are packed in water, solids
and liquids, no added sweeteners.
Frozen fruit in this table is unsweetened.